Bollinger Bands Strategy for Binary Options | Using Counter-Trend and Trend-Following

Going counter-trend on a Bollinger Band touch alone often leads to misreads. This explains how to choose between counter-trend and trend-following using band width, touch count and the middle band slope.
Try a free demo now
Experience the real trading environment without using real money
You entered Low because the price touched the upper Bollinger Band, and the price kept climbing and you lost. Have you had a loss like that when you first started using Bollinger Bands? A touch of the band is not a reversal signal. Its meaning changes depending on the state of the market at that moment. This article explains how to decide between counter-trend and trend-following trades using three things you can see on the chart: the width of the bands, the number of consecutive touches, and the slope of the middle band.
The basic structure of Bollinger Bands
Bollinger Bands are an indicator built around a moving average, with lines above and below showing how widely the price is dispersed. The center line is the middle band, which by default is a 20-period simple moving average. Lines at ±1σ, ±2σ, and ±3σ are drawn outside it, and the one MT5 shows first is ±2σ.
The theoretical probability that the price stays inside each line is as follows.
Line | Theoretical probability of staying inside |
|---|---|
±1σ | 68.3% |
±2σ | 95.4% |
±3σ | 99.7% |

The width of the bands changes along with how volatile the price is. When price movement gets smaller the bands contract, and when it gets larger the bands expand. These changes in width are called the squeeze and the expansion, and they are the first clue for choosing between counter-trend and trend-following trades.
A band touch is not a buy or sell signal
A touch of the band is not a buy or sell signal. It is only a marker showing that the price has reached that point. After a touch, the price may reverse, or it may keep going in the same direction.
If you treat a touch as a reversal signal, you are likely to misjudge repeatedly during a band walk, when the price keeps moving along the band. A touch is one piece of evidence. Keep in mind that it does not decide the direction on its own.
How to choose between counter-trend and trend-following by market state
The shape of the bands itself tells you the current market state. Without adding any other indicator, you can use just the look of the bands to sort the situation into three choices: counter-trend, trend-following, or waiting. Check the table below.
Band state | Recommended trade | Sign to look for | Caution |
|---|---|---|---|
Squeeze | Wait | The band width is clearly narrower than recently, and the price moves back and forth in a small range near the center | Entering early before the direction is set |
Breakout right after a squeeze | Prepare for trend-following | The bands suddenly start to open and the price starts to extend toward one side's band | A false breakout that extends once and quickly returns |
Band walk | Trend-following | The middle band slopes in the same direction, and several touches on the same side occur in a row | A counter-trend trade that reads the touch as a reversal |
Range | Counter-trend | The middle band is almost flat, and recent touches on the same side have already reversed | Mistaking the market for a range when the bands have started to widen |
The same band touch can be a reason to aim for a reversal in a range, but during a band walk it is a sign of continuation. It matters more to first check what state the touch happened in than the touch itself.

Want to know more about how to decide between trend-following and counter-trend? Check this article! ▶︎Trend Following and Contrarian Trading in Binary Options | The Complete Guide to Choosing by Market Condition
Three checks to tell the market state
By checking the following three things, you can judge the current market state. This method works even before you learn RSI or MACD.
- Band width: Compare it with the last several dozen candles and see whether it is narrowing or widening.
- Number of touches: Count which side's band the price is touching and whether it is just one candle or two or more in a row.
- Slope of the middle band: Check whether it is close to flat or clearly tilted to one side.
Check the combination of the following three to see what action to take.
- Narrow width and no touch on either band → wait
- Width starting to widen and only one touch → do not decide yet and wait for the next candle
- Wide width and two or more touches in a row on the same side → trend-following
- Width roughly constant, middle band flat, one touch and the price shows a reversal move → counter-trend

When in doubt, choose to wait. In binary options, skipping an entry does not cost you anything. Waiting until the market becomes clear is what stabilizes your win rate.
How to proceed with counter-trend and trend-following trades
Counter-trend in a range market
When the middle band is flat and the band width is steady, the price is less likely to break outside ±2σ. You aim for a move back toward the center: Low when it touches the upper band, High when it touches the lower band.
A good guide for entry is when the candle that touched the band does not close its body outside the band and is pushed back by an upper or lower wick. Once two touches on the same side occur in a row, the premise of a range has broken down. Skip counter-trend trades from that point. Returning to the middle band is the guide for taking profit.

Trend-following in a trend market
When the bands are open and the price keeps rising along the upper band, or keeps falling along the lower band, that is a band walk. At this point, do not go counter-trend at every touch. Enter in the direction the price is extending.
The easiest spot to target is where the price is pushed back once near the middle band and then starts moving toward the band again. When the slope of the middle band eases and gets close to flat, it is a sign the trend is heading toward its end, so stop trend-following. When you catch a trend you may be able to win several times in a row, but be careful with money management so you do not raise your investment per trade too much.

How to enter on a breakout after a squeeze
When the bands suddenly start to open from a narrow state, the expansion has begun. The price starts moving toward the band on the side it broke through, and the slope of the middle band also shifts in that direction.
However, if you decide based only on the first candle after the opening begins, you will get caught by a move that extends briefly and then returns to the original range. Wait until another touch occurs on the same side or until the slope of the middle band becomes clear before you enter. Right after a breakout the price moves fast, and if your direction is right, it is a situation where results tend to come in a short time.

Why you should not treat the ±2σ probability as a win rate
The figure that 95.4% stays inside ±2σ is a theoretical value calculated on the assumption that price movement follows a normal distribution. Actual price movements in forex and cryptocurrencies do not follow the shape of a normal distribution, and large moves that count as outliers occur frequently. As a result, the proportion that stays inside ±2σ or ±3σ does not necessarily match the theoretical value.
In other words, you cannot reason that "it touched ±2σ, so there is a 95% chance it will come back." This figure is only a guide to how rare a position outside the band is. A band walk, where the price keeps moving while stuck outside ±2σ, is often seen when a strong trend is in progress.
The relationship between expiry time and how you choose
Binary options have a constraint that discretionary forex trading does not: the expiry time. Even if your direction is right, you lose if the price has come back at the moment of expiry.
Counter-trend is a type of trading where it is hard to read exactly when a reversal will start. The shorter the expiry time, the higher the risk that expiry arrives before the reversal has time to happen. If you choose counter-trend, we recommend limiting it to situations where the range width is clear and the reversal comes quickly.
Trend-following already has a direction, so it also works well with short expiry times. When entering during a band walk, a shorter expiry time that settles within the next one or two candles makes it less likely you get caught by a pullback along the way.
Bollinger Bands settings in MT5
Many charting tools, including MT5, come with Bollinger Bands built in. In MT5, open the Insert menu, go to Indicators and then Trend, and select Bollinger Bands to use it.
The default is a period of 20 and a deviation of 2. If you widen the deviation to 2.5 or 3, the number of touches decreases, and each touch carries that much more weight. If you want to narrow down your counter-trend entries, try the wider deviation display as well. Once it is displayed, choosing a timeframe where the slope of the middle band is easy to see will speed up your judgment of the state.
Want to know about other recommended indicators besides Bollinger Bands? Check this article! ▶︎Recommended Binary Options Indicators | Combinations and How to Choose for Beginners
Frequently asked questions
Q1. When a squeeze happens, should I prepare for trend-following or counter-trend?
Neither. Waiting is the basic response. A squeeze is a preparation state before the direction is decided, and which way the price will start moving is not yet determined. Consider trend-following after you confirm the price has started to extend in the direction of the breakout, and if it returns to the original range without extending, look again at it as a counter-trend opportunity.
Q2. When is it easy to mistake the market for a range?
It happens when the bands are only temporarily narrow and the market is actually taking a short pause in the middle of a trend. If the slope of the middle band is not completely flat, there remains a possibility that the trend is still continuing. If you enter counter-trend here, you are likely to get caught in a band walk in the same direction again. Do not skip checking the slope.
Q3. If the price touches a Bollinger Band, can I go counter-trend on that alone?
We do not recommend a counter-trend trade based only on a touch. A contact with the band is a marker showing the price has reached that point, not a signal to buy or sell. Aim only for situations where the middle band is flat and recent touches on the same side have reversed.
Q4. Do I need other indicators to judge the band state?
Bollinger Bands alone can be used to judge the market state, but we recommend avoiding deciding trades on a single indicator. Adding RSI or MACD to confirm direction gives your decision more support. Bi-Winning also distributes a free signal tool.
Want to know how to use RSI specifically? Check this article! ▶︎How to Use RSI in Binary Options | Settings and Avoiding False Signals
Summary
The key point when using Bollinger Bands is to check the market state before reacting to a touch.
- Judge the state with three things: band width, number of touches, and the slope of the middle band
- Counter-trend in a range, trend-following in a band walk, and waiting in a squeeze
- The theoretical probability at ±2σ does not become your win rate as it is
This is not limited to Bollinger Bands: what an indicator shows is only a signal. Do not trust it 100%, and use it as a reference tool.
Until you get used to the judgment, keep practicing checking the market state on real charts. With a Bi-Winning demo trade, you can try it without using funds. Start by displaying Bollinger Bands and judging which state the current market is in.
Experience the Bi-Winning trading platform risk-free
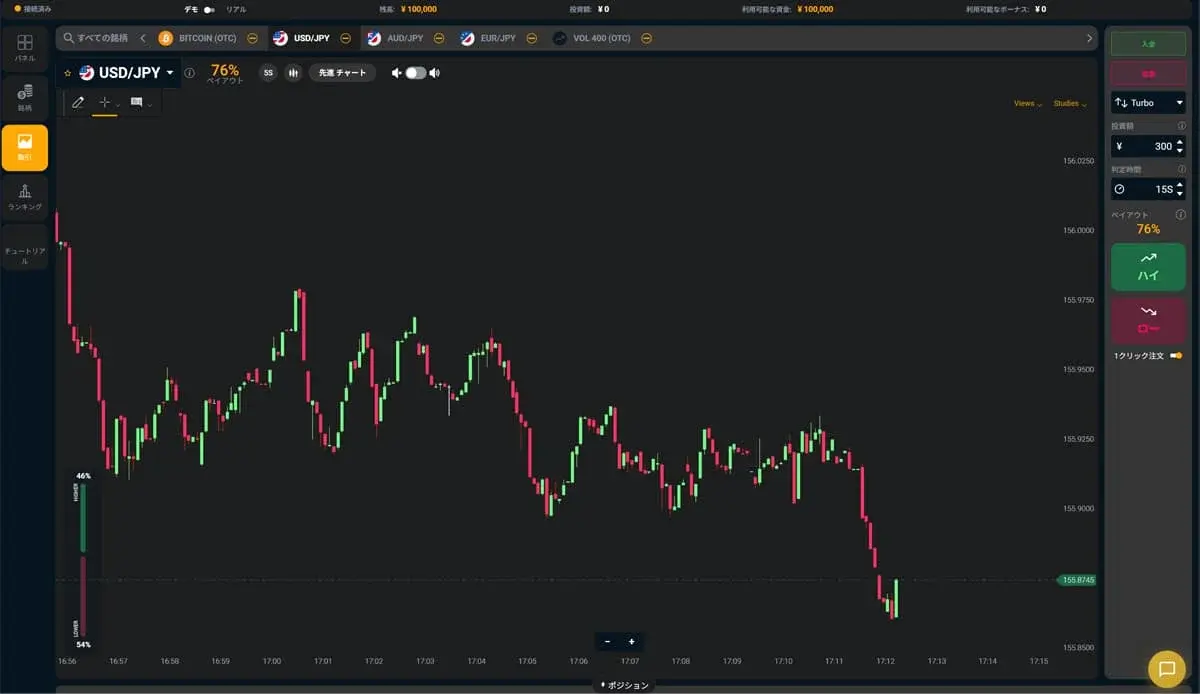
Try the Bi-Winning trading platform for free right now. No registration required to try High/Low trading. Your demo account comes with 100,000 JPY in virtual funds.
Try a free demo now
Experience the real trading environment without using real money
Company Information
Providing a safe, secure, and comfortable trading environment for all investors.
| Company | Alpha Options LLC |
| Location | Euro House, Richmond Hill Road, Kingstown, St. Vincent and the Grenadines |
| Support Hours | 10:00 – 17:00 (JST)Excluding weekends, holidays, and year-end closures |
| Business Succession | Succeeded from BET GLOBAL MARKET INC. on February 7, 2025 |
| Contact | Contact Us |
| Official Twitter | https://x.com/BIWINNING1 |
関連記事
How to Use Moving Averages in Binary Options | Period Settings and the Perfect Order
Struggling to choose periods and judge the perfect order? This explains the four MT5 calculation methods, periods by expiry time, the 2-line golden cross vs. 3-line perfect order, and checks against false signals.

How to Buy Crypto with an On-Ramp | Steps to Buy USDT by Credit Card and Deposit It
Learn how to buy crypto with an on-ramp. This guide covers 6 steps to buy USDT with a Japanese credit card, a route that needs no account opening, the purchase range, and how to deposit into Bi-Winning.

Can You Trade Binary Options on Weekends? Which Instruments Move and How They Differ From Weekdays
In binary options, forex currency pairs stop moving on weekends while only crypto instruments keep going. This article covers which instruments you can trade on weekends, how market conditions vary by day of the week, how to set your expiry time, and the Monday gap.