Recommended Binary Options Indicators | Combinations and How to Choose for Beginners

A beginner's guide to binary options indicators. The conclusion is moving average + RSI. It sorts trend and oscillator types, good combinations, settings by expiry time and how to choose, with limits and risks.
Try a free demo now
Experience the real trading environment without using real money
The first wall you hit when you start binary options is probably the question: "So which indicator should I actually use?" When you open a chart, an unfamiliar row of lines such as moving averages and RSI is lined up, and the more of a beginner you are, the more overwhelmed you feel by the number of choices.
To get straight to the conclusion, what we recommend is the combination of "moving average + RSI." It covers the direction of the market and whether it is overheated with one indicator each, and the screen does not get cluttered, so it is easy to decide without hesitation. This article sorts the standard binary options indicators into "trend-following" and "counter-trend" types, and then explains, in order, combinations that work well together, how to think about settings specific to binary options, and how to choose the ones that suit you.
Why use indicators in binary options
Binary options is trading where you predict whether an exchange rate will be "higher or lower" after a set time. Because the outcome is decided quickly, you inevitably need a basis for deciding your entry timing.
An indicator (technical indicator) is a tool that processes past prices and other data with a formula and turns it into something you can see on the chart. The purposes of using one boil down to roughly the following three.
- Grasp the market trend (direction)
- Measure overheating, such as overbought and oversold conditions
- Have a standard for deciding whether to enter or skip
The thing to keep in mind here is that an indicator is only a tool that helps your judgment, not magic that predicts the future with perfect accuracy. Since every indicator is calculated from past data, it is weak against sudden market changes and also produces missed signals known as "false signals." Whether you keep this premise in mind makes a big difference to how stable your trading is afterward.
Indicators fall into two broad types
Of the many indicators out there, if you sort them by nature they divide into two types: "trend type (trend-following)" and "oscillator type (counter-trend)." Each has different markets it handles well, so we recommend learning this division first.
Category | Market it handles well | Main role | Representative indicators |
|---|---|---|---|
Trend type | Trending market | Grasp the direction of the market | Moving average, MACD, Ichimoku Kinko Hyo |
Oscillator type | Range market | Measure overbought and oversold conditions | RSI, Stochastic Oscillator |
In between | Handles both | Judge reversal or continuation from the swing in price | Bollinger Bands |
With these two types in mind, you can think in the flow of "Is the current market a trend or a range?" and then "So which indicator suits it?"
Characteristics and use of trend-type (trend-following) indicators
Trend-type indicators really show their strength when the market is moving strongly in one direction. They work well with "trend-following" trades, where you enter by riding that flow.
Moving average (MA)

A moving average connects the average of closing prices over a set period with a line, and it is the most basic of all technical indicators. Just by looking at the direction of the line, you can tell the direction of the market at a glance.
- Line pointing up: uptrend
- Line pointing down: downtrend
- Price above the line: buyers dominate; below: sellers dominate
Displaying two lines, a short-term line and a long-term line, widens how you can use it. A "golden cross," where the short-term line crosses the long-term line from below to above, is an upward sign, and a "dead cross," where it crosses from above to below, is a downward sign. Many people have probably heard this. Periods of around 5 to 25 for the short line and 75 to 200 for the long line are commonly used, but in binary options the basic rule is to shorten them to match the timeframe you trade.
Want to know more about moving average period settings and how to read a perfect order? Check this article! ▶︎How to Use Moving Averages in Binary Options | Period Settings and the Perfect Order
MACD

MACD is an indicator based on the exponential moving average (EMA: a moving average that emphasizes recent prices), and it consists of three parts: the MACD line, the signal line, and the histogram. The standard settings are 12 for the short EMA, 26 for the long EMA, and 9 for the signal line, and in many charting tools these numbers are the defaults. The basic way to read it is to buy when the MACD line crosses above the signal line and sell when it crosses below. Its strength is that it picks up changes in momentum earlier than a simple moving average crossover. However, because it is based on moving averages, it still lags a little behind the price, and in a range market signals appear frequently and false signals tend to increase, so you need to accept those points when you use it.
Ichimoku Kinko Hyo

Ichimoku Kinko Hyo is an indicator born in Japan, and its landmark is a band called the "cloud (resistance band)." If the price is above the cloud, the trend is up, and if it is below, the trend is down. At first, just looking at this is enough. It displays many lines and carries a great deal of information, so while you are a beginner we recommend narrowing down to the position relative to the cloud only.
Characteristics and use of oscillator-type indicators
Oscillator-type indicators move up and down within a fixed range (mostly 0 to 100) and tell you how overheated the market is. They work well with "counter-trend" trades, where you aim for a reversal at the point where the price has gone too far, and they tend to function in range markets.
RSI

RSI is an indicator that shows overbought and oversold conditions on a scale of 0 to 100 from the ratio of gains to losses over a set period. The general guide is as follows.
- 70 or higher: overbought (watch for a reversal downward)
- 30 or lower: oversold (watch for a reversal upward)
- A period of 14 is commonly used
The basic way to use it is to aim for the opposite direction when the value swings to an extreme. There is a caution, though: when a strong trend appears, RSI can stay stuck at 70 or above or 30 or below and keep moving there, and going counter-trend in that situation will hurt you.
Note: For RSI settings and how to avoid false signals, see "How to Use RSI in Binary Options | Settings and Avoiding False Signals" for details.
Stochastic Oscillator

The Stochastic Oscillator is an indicator that shows where the latest price sits within the high and low of a set period, and like RSI it measures overbought and oversold conditions. It consists of two lines, %K and %D, and it is generally read as overbought at 80 or above and oversold at 20 or below. The standard settings are %K 5, %D 3, and Slowing 3. Increasing the numbers makes the lines move more smoothly, and decreasing them makes it react faster. Because it reacts faster than RSI, it has the character of producing signals more easily.
Bollinger Bands

Bollinger Bands are an indicator that draws bands above and below a moving average, calculated with the standard deviation (σ: how widely the price is dispersed). The standard period for the moving average used as the center line is 20, and lines at ±1σ, ±2σ, and ±3σ are drawn from there. The probability that the price stays inside ±2σ is said to be about 95% in theory. They are characterized by having the properties of both the trend type and the oscillator type.
Prices tend to stay inside the bands for the most part, so they are used for counter-trend trading, reading the area near the upper band as overbought and the area near the lower band as oversold. On the other hand, an "expansion," where the bands suddenly widen, is a sign that a trend has begun, so they can also be used for trend-following decisions.
Note: For how to choose between counter-trend and trend-following with Bollinger Bands, see "Bollinger Bands Strategy for Binary Options | Using Counter-Trend and Trend-Following" for details.
Here is a summary of the standard settings and judgment guides for the six indicators so far.
Indicator | Standard setting | Judgment guide |
|---|---|---|
Moving average | Short 25, long 75 | When the short line crosses above the long line, it is an upward sign |
MACD | 12, 26, 9 | When the MACD line crosses above the signal line, it is an upward sign |
Ichimoku Kinko Hyo | Conversion line 9, base line 26, leading span 52 | Price above the cloud means an uptrend, below means a downtrend |
RSI | Period 14 | 70 or higher is overbought, 30 or lower is oversold |
Stochastic Oscillator | %K 5, %D 3, Slowing 3 | 80 or higher is overbought, 20 or lower is oversold |
Bollinger Bands | Period 20, ±2σ | Reversal near ±2σ, trend begins when the bands expand |
Points specific to binary options
A feature of binary options is that the expiry time is decided in advance at the moment you enter. This is a big difference from forex and similar trading, where you can choose the holding time to suit yourself, and it directly affects your indicator settings.
For example, in short trades of 30 seconds to 5 minutes, the long moving averages of 75 to 200 hardly move, so they are not material for reading the price movement up to the expiry time. The basic rule is to shorten the indicator setting periods as well to match the timeframe you trade. For short-term trading, shortening the reference periods of RSI and Bollinger Bands below the standard to speed up the reaction also makes it easier to catch the movement up to the expiry time.
The guide to settings by trading time is as follows.
Trading time | Timeframe to watch | Moving average | RSI | Bollinger Bands |
|---|---|---|---|---|
30 seconds to 1 minute | 1-minute chart | 5 and 20 | 7 to 9 | Period 14, ±2σ |
3 to 5 minutes | 1-minute to 5-minute chart | 5 and 25 | 9 to 14 | Period 20, ±2σ |
15 minutes or more | 5-minute to 15-minute chart | 20 and 75 | 14 | Period 20, ±2σ |
All of these are commonly used reference values. Start within these ranges, use the same settings for a set period, check how well they fit the price movement, and adjust from there.
As the expiry time gets closer, whether the price gets "one more push to reverse" directly decides win or loss, so even a signal that is correct on a longer timeframe may not make it in time with only a few minutes left. Think about the timeframe you use and the indicator periods together. That is the caution specific to binary options.
Recommended indicator combinations for binary options
A single indicator is weak against false signals, so the standard approach is to combine indicators with different natures to raise accuracy. The basic form is to pair one "trend type" with one "oscillator type" and check direction and overheating at the same time.
Combination | Aim | Suitable market | Example of a decision |
|---|---|---|---|
Moving average + RSI | Check direction and overheating at the same time | Both trend and range | If RSI drops to 30 during an uptrend, consider the upward direction |
Bollinger Bands + RSI | Raise the accuracy of counter-trend trades | Range market | Reaching the lower band with RSI at 30 or below: consider the upward direction |
MACD + Stochastic Oscillator | Check trend momentum and reversal | Trend turning point | MACD crosses up and the Stochastic Oscillator turns up from 20: consider the upward direction |
Moving average + Bollinger Bands | Measure the strength of the trend | Trending market | Bands expand and the moving average points up: consider trend-following |
If a beginner is going to choose just one to start with, we recommend the "moving average + RSI" we mentioned at the beginning. It can be used in a balanced way in both trends and ranges, and the display is simple, so it is easy to decide without hesitation. It is just right as an entry point when you think, "Let's start here for now."
The key rule of combining is to "not choose indicators whose roles overlap." For example, RSI and the Stochastic Oscillator are both oscillator types with similar characters, so even if you line the two up, you end up with much the same information, and the point of combining them fades. Overlapping trend-type indicators is the same thing.
Note: For how to choose between trend-following and counter-trend, see "Trend Following and Contrarian Trading in Binary Options | The Complete Guide to Choosing by Market Condition" for details.
How to choose indicators: four criteria for beginners
When choosing the indicator that suits you, thinking in the following order makes it harder to get lost.
- Decide your own trading style
- Choose the type that fits your style
- Combine one indicator of each type with different natures
- Use the same settings for a while, verify them with demo trading, and then move to live trading
If you display several indicators from the start, the signals contradict each other and you end up unable to move either way, which is called "analysis paralysis." This is the most common mistake beginners make. Narrow your indicators down to two or three, and first make full use of one combination.
If you want to try settings and combinations, rather than going live right away, we recommend starting from the risk-free demo environment and trying out how to read price movement and signals. With Bi-Winning, you can display indicators on a real chart in demo trading and check how it feels to operate them. We also recommend trying the adjustment of setting periods to match the expiry time several times in the demo before moving to live trading.
Cautions and risks when using indicators
Indicators are convenient, but you must not overtrust them.
- An indicator is a calculation on past data and does not reliably predict the future
- Every indicator has "false signals," and there will always be situations where the price does not move as the signal suggests
- Stacking indicators of a similar type does not raise accuracy and tends only to complicate your decisions
- Technical analysis works poorly in situations where the market changes suddenly, such as when major economic indicators are released
An indicator is only one piece of material for your decision. Only when you pair it with money management can you finally control risk.
Note: For points to watch around economic indicator releases, see "What to Watch Out for When Trading During Economic Indicator Releases | Key Precautions for Beginners" for details.
The specific methods of money management are explained in the following article.

Frequently asked questions
Q1. Do I need indicators for binary options?
They are not required, but they help you have a standard for decisions. There is a way of reading price movement from candlesticks alone, but with indicators you can check the direction and overheating of the market as numbers, which draws a clearer line between entering and skipping. In binary options, where the expiry time is set, the less time you spend hesitating, the more it works in your favor.
Q2. Is there an indicator that always wins?
No. Every indicator displays the result of calculating past prices and is not a mechanism that guarantees future price movement. Some tools advertise a high win rate, but that figure is tallied over a particular period and market conditions, and the same result does not necessarily continue. The premise is to assume false signals will happen and to use indicators together with money management.
Q3. Can I use indicators for free?
The moving average, MACD, Ichimoku Kinko Hyo, RSI, Stochastic Oscillator, and Bollinger Bands come built in to major charting tools such as MT5 and TradingView, and you can use them at no additional cost. Bi-Winning also distributes a free tool.
Want to know more about indicators you can use for free? Check this article! ▶︎Free Binary Options Indicators: How to Choose and Standards for Not Over-Trusting Them
Q4. How many indicators can I display?
We recommend narrowing it down to two or three. If you increase the number, the signals contradict each other and you spend longer hesitating over decisions. Stacking indicators of the same type adds no new information. A combination of one from the trend type and one from the oscillator type strikes a good balance between the amount of information and readability.
Q5. What is the difference between a signal tool and an indicator?
An indicator displays the state of the market with numbers or lines, and you make the trading decision yourself. A signal tool combines the conditions of several indicators in advance and notifies you with an arrow or the like on the chart when the conditions line up. It reduces the effort of deciding, but unless you understand the conditions it is based on, you end up following signals even in markets where the signals tend not to work.
Note: For the installation steps of the Bi-Winning signal tool, see "Bi-Winning Signal Tool Setup: A Guide with Images to Installing It in MT5."
How to break free from gut-feeling trading is explained in the following article.

Summary
Binary options indicators are best understood by dividing them into two groups: "trend type (trend-following)" and "oscillator type (counter-trend)." Here are the key points.
- For beginners, we first recommend "moving average + RSI." It covers direction and overheating with one indicator each, and the display is simple so you do not get lost
- Trend types (moving average, MACD, Ichimoku Kinko Hyo) are suited to grasping the direction of the market
- Oscillator types (RSI, Stochastic Oscillator) are suited to measuring overbought and oversold conditions
- Bollinger Bands have both properties, and can be used for counter-trend trading that reads the area near the upper band as overbought and the area near the lower band as oversold, and also for trend-following using the expansion
- Because binary options have a set expiry time, adjust the setting periods shorter to match the timeframe you trade
- Keep the display to two or three indicators and avoid overlapping the same type
- Indicators are not all-powerful, and carry the risk of false signals and sudden market changes
Start by trying the "moving average + RSI" combination in a Bi-Winning demo trade and check whether it suits your style. Understand indicators correctly, and use them while staying aware of the risks. This is the foundation of stable trading.
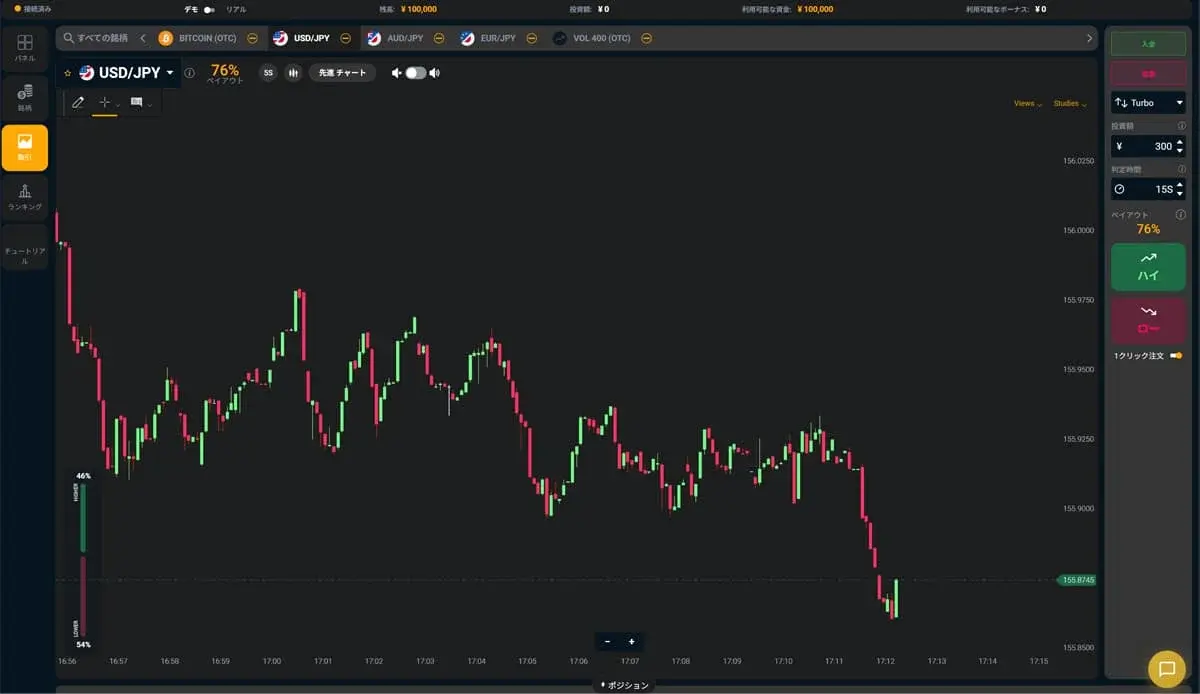
Experience the Bi-Winning trading platform risk-free
Try the Bi-Winning trading platform for free right now. No registration required to try High/Low trading. Your demo account comes with 100,000 JPY in virtual funds.
Try a free demo now
Experience the real trading environment without using real money
Company Information
Providing a safe, secure, and comfortable trading environment for all investors.
| Company | Alpha Options LLC |
| Location | Euro House, Richmond Hill Road, Kingstown, St. Vincent and the Grenadines |
| Support Hours | 10:00 – 17:00 (JST)Excluding weekends, holidays, and year-end closures |
| Business Succession | Succeeded from BET GLOBAL MARKET INC. on February 7, 2025 |
| Contact | Contact Us |
| Official Twitter | https://x.com/BIWINNING1 |
関連記事

How to Use Moving Averages in Binary Options | Period Settings and the Perfect Order
Struggling to choose periods and judge the perfect order? This explains the four MT5 calculation methods, periods by expiry time, the 2-line golden cross vs. 3-line perfect order, and checks against false signals.
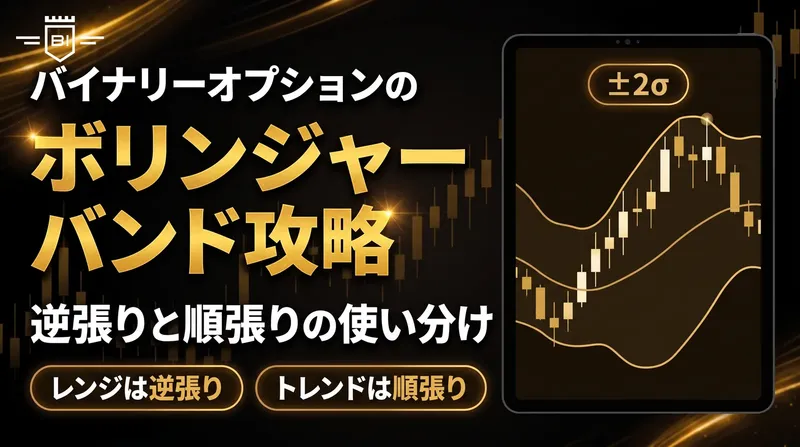
Bollinger Bands Strategy for Binary Options | Using Counter-Trend and Trend-Following
Going counter-trend on a Bollinger Band touch alone often leads to misreads. This explains how to choose between counter-trend and trend-following using band width, touch count and the middle band slope.
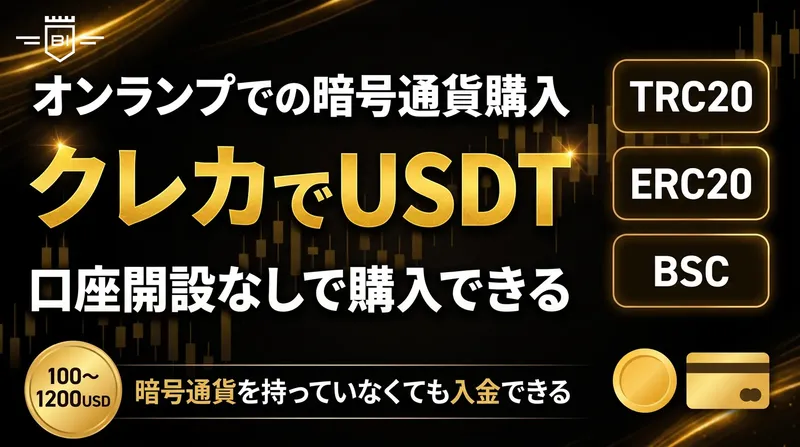
How to Buy Crypto with an On-Ramp | Steps to Buy USDT by Credit Card and Deposit It
Learn how to buy crypto with an on-ramp. This guide covers 6 steps to buy USDT with a Japanese credit card, a route that needs no account opening, the purchase range, and how to deposit into Bi-Winning.