How to Use RSI in Binary Options | Settings and Avoiding False Signals

How to use RSI in binary options: settings and avoiding false signals. Covers the basis for period 14 and 70/30/50, why signals fail in strong trends, a reliability chart, and a four-gate check.
Try a free demo now
Experience the real trading environment without using real money
RSI is a popular indicator that shows at a glance whether a market is overbought or oversold. Yet many people who start using RSI in binary options (trading that predicts short-term price moves) hit the same first wall: "It went above 70 and kept rising," or "I placed a High trade when it dropped below 30, and the price kept falling." These are what we call false signals, where the price does not move the way the signal suggests.
This article goes beyond the surface rules of RSI. It explains, from the structure of the market, why false signals make you lose, and then covers the right period setting for steadier results and a concrete entry procedure that systematically filters out false signals.
What is RSI? Start with the basics from the primary source

RSI (Relative Strength Index) is a technical indicator developed by J. Welles Wilder in 1978. It expresses the share of upward movement within a set period of price action as a value from 0 to 100%.
- RSI = 100 −(100 /(1 + RS))
- RS = average gain over the period / average loss over the period
The calculation uses a smoothed moving average (SMMA), which smooths out recent price movement, and the standard period in the developer's original work is 14. The general reference levels are as follows.
- 70 or higher: overbought (a sign that the rise is overheated)
- 30 or lower: oversold (a sign that the decline is overheated)
- 50: neutral (the line where upward and downward pressure are balanced)
The key point here is that RSI works best in a range-bound (sideways) market. When a strong trend develops and the price moves fast in one direction, RSI can stay stuck in the zone above 70 or below 30 and fail to come back, so the indicator stops working properly (false signals appear).
How to choose RSI settings: a shorter period does not mean more wins
The setting beginners struggle with most is the period. It is tempting to think that a shorter period reacts faster and is therefore better, but speed of reaction and fewer false signals are a trade-off.
How to choose the RSI period (by trading style)
Period setting | Reaction speed | Signal frequency | Likelihood of false signals | Best suited for |
|---|---|---|---|---|
Period 14 (Wilder standard) | Slow | Low | Low | Assessing market conditions and building a foundation for your reasoning |
Period 9 | Medium | Medium | Medium | A balanced option for short-term decisions on 1 to 5 minutes |
Period 2 to 7 (ultra-short) | Fast | High | High | Ultra-short trades of 30 seconds to 1 minute, but a filter is required |
Recommended way to combine them
In practice, the most balanced setup is to use period 14 as the base to gauge how overheated the market is overall, and then use period 9 alongside it to fine-tune the actual entry timing. This reduces false signals.
How false signals happen: reliability changes with market conditions
RSI false signals are not a flaw in the indicator. They happen when the market condition and the strategy you are aiming for do not match. Even the same signal can be completely reliable or unreliable depending on the state of the market.
Market condition × reliability of RSI signals (quick reference)
Market condition | Reliability of 70/30 signals (counter-trend) | Reliability of a 50-line break (trend-following) | Main false signals in this situation |
|---|---|---|---|
Range (sideways) | High | Low | Few (counter-trend trades tend to work) |
Strong trend in progress | Low (RSI sticks and stops working) | High | Counter-trend entries that are too early, assuming "above 70 means reversal" |
Early stage of a trend reversal | Medium | Medium | Divergence that does not lead to a reversal |
Why RSI sticks in a strong trend
RSI is calculated from the ratio of gains to losses. In a market that keeps rising in one direction without any pullback, the denominator (the loss) becomes extremely small, and the RSI value stays fixed at a high level close to 100. That is why an early counter-trend entry such as "it is above 70, so go Low" during a trend is the classic pattern that loses most often. Whether counter-trend trading works depends less on the RSI value itself than on whether the market is currently in a range.
RSI false signal avoidance procedure: what to check before you enter
Even if you know when to be suspicious, making that call every time in a live market is hard for a beginner. So turn it into a decision flow: even when an RSI signal appears, only a setup that passes the following four checks, in order from the top, becomes an entry candidate. We call this the "four-gate" check. If you decide in advance which conditions are off limits, you can avoid false signals structurally.
Point 1: Check the trend
If recent highs and lows keep rising (or falling) in one direction, treat it as a strong trend and, as a rule, skip every counter-trend trade based on RSI alone (Low above 70, High below 30). Only enter in a range market, where the price moves back and forth within a certain band.
Point 2: Optimize the period setting
Check that the period suits the timeframe you are trading (14 as the base, 9 to raise sensitivity for short-term trades). Do not trade on your own with extreme ultra-short settings (2 to 7).
Point 3: Wait for the candle to close
Do not jump in early while the RSI value is still moving in real time. Always confirm that, at the moment the candlestick closes, RSI has come back inside from the 70 or 30 zone.
Point 4: Confirm with other technical indicators
Avoid entering on an RSI signal alone. A typical combination is to aim only for the moment when another independent reason lines up, such as a touch of the Bollinger Bands' ±2σ followed by a return inside the band, or the candlestick itself forming a reversal shape (such as a pin bar with a long wick).
The typical ways to lose with RSI are a counter-trend entry that is too early in a strong trend and an early entry before the candle closes. Decide your "do not enter" conditions first. That is the most effective defense against false signals.
Frequently asked questions about RSI
Q1. Is there a "correct" RSI setting?
There is no single correct answer, but the base value traders around the world pay the most attention to is the developer Wilder's period 14. Many people use 9 to speed up the reaction in 1 to 5 minute binary options trades, but do not forget the principle that the shorter the period, the more false signals you get.
Q2. If divergence appears, can I trade for a reversal?
Divergence shows that momentum is fading (a hint), and it is not enough to pinpoint the exact moment of a reversal. During a strong trend, divergence can appear several times in a row before the price actually tops out (without leading to a reversal), so you need to wait for another indicator to confirm the reversal.
Q3. Which timeframe is best to watch for binary options?
For assessing short-term trading conditions, watching the 1-minute chart is common. As a combination that works well, pairing RSI with counter-trend trading using Bollinger Bands, which show the framework of the trend, is widely recommended as a pattern that sharply cuts unnecessary entries (false signals).
Summary: Putting it into practice at Bi-Winning
RSI is a very powerful weapon, but a simple approach of "go counter-trend at 70 and at 30" can pull you into a trending market and cause large losses.
- Use period 14 as your base, and fine-tune with 9 when you want a faster reaction.
- RSI signals change drastically in reliability depending on the market environment (range = counter-trend works, trend = RSI sticks and it is dangerous).
- Before every entry, always check the four points: assess the environment, choose the period, confirm the closed candle, and look for overlapping reasons.
Start with a risk-free demo trade
Rather than using it in live trading right away, the surest way is to use a Bi-Winning demo account and get a feel for how false signals behave through the following steps.
- Days 1 to 2: Every time you open the chart, before looking at the RSI value, practice judging by eye whether the current market is a range or a trend.
- Days 3 to 4: After RSI goes beyond 70 or 30, compare past charts to find cases where the price kept going (false signals) and cases where it reversed, and record how the market background differed.
- Days 5 to 7: Simulate only the points that clear all four gates, and check how much unnecessary losses decrease.
Building up prior testing and risk-free practice is the surest path to making profits consistently over the long term.
Check this article for other recommended indicators!
→ Recommended Binary Options Indicators | Combinations and How to Choose for Beginners
Experience the Bi-Winning trading platform risk-free
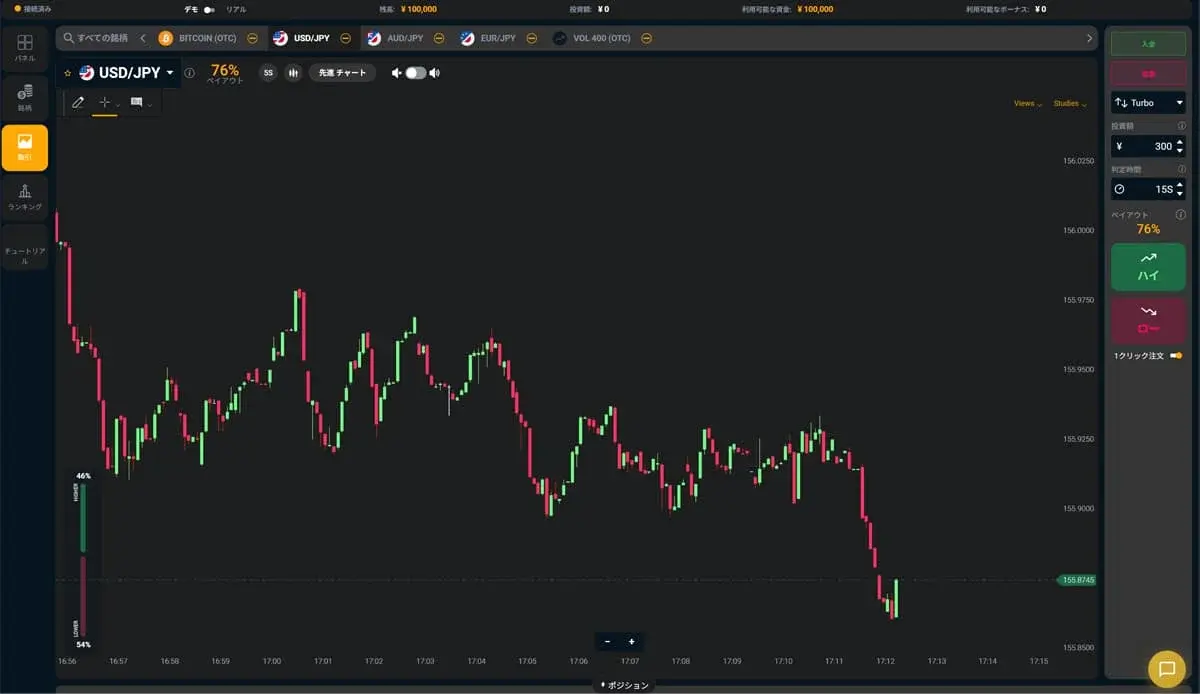
Try the Bi-Winning trading platform for free right now. No registration required to try High/Low trading. Your demo account comes with 100,000 JPY in virtual funds.
Try a free demo now
Experience the real trading environment without using real money
Company Information
Providing a safe, secure, and comfortable trading environment for all investors.
| Company | Alpha Options LLC |
| Location | Euro House, Richmond Hill Road, Kingstown, St. Vincent and the Grenadines |
| Support Hours | 10:00 – 17:00 (JST)Excluding weekends, holidays, and year-end closures |
| Business Succession | Succeeded from BET GLOBAL MARKET INC. on February 7, 2025 |
| Contact | Contact Us |
| Official Twitter | https://x.com/BIWINNING1 |
関連記事

How to Use Moving Averages in Binary Options | Period Settings and the Perfect Order
Struggling to choose periods and judge the perfect order? This explains the four MT5 calculation methods, periods by expiry time, the 2-line golden cross vs. 3-line perfect order, and checks against false signals.

Bollinger Bands Strategy for Binary Options | Using Counter-Trend and Trend-Following
Going counter-trend on a Bollinger Band touch alone often leads to misreads. This explains how to choose between counter-trend and trend-following using band width, touch count and the middle band slope.

How to Buy Crypto with an On-Ramp | Steps to Buy USDT by Credit Card and Deposit It
Learn how to buy crypto with an on-ramp. This guide covers 6 steps to buy USDT with a Japanese credit card, a route that needs no account opening, the purchase range, and how to deposit into Bi-Winning.