What Economic Indicators Matter in Binary Options? A Beginner's Guide to Key Indicators and Release Schedules

A beginner-friendly guide to the economic indicators that move the market in binary options trading. We cover the meaning, release times, and market impact of key indicators like the US Employment Report, FOMC, CPI, and GDP, plus how to put them to use on Bi-Winning.
Try a free demo now
Experience the real trading environment without using real money
Have you ever looked at a chart and wondered, "why did the price suddenly move so much?" That sudden swing is often caused by the release of an "economic indicator." Understanding economic indicators lets you anticipate when the market is likely to move, which can be a real help when deciding your binary options entries. In this article, we'll cover the key indicators beginners should know first, looking at each one from three angles: what it measures, its release schedule, and its impact on the market.
What Is an Economic Indicator?
An economic indicator is data released by a country's government, central bank, or private organizations that expresses the state of the economy in numbers. These figures come out regularly across areas like employment, prices, business conditions, and consumer spending, and they move the forex and stock markets.
Let's clarify how this connects to binary options. Binary options trading involves predicting whether a price will go "up" or "down" after a set amount of time. When prices barely move, predictions are difficult, but when the market makes a big move, a clear direction tends to emerge. Economic indicator releases are a prime example of exactly this kind of "market-moving moment." That's precisely why so many traders check the indicator calendar almost every week.
Importance Rankings for Economic Indicators
There really are a huge number of economic indicators, but you don't need to memorize them all right from the start. Economic indicator calendars typically rank indicators by market impact, using labels like "three stars" or "High," so start by getting familiar with the ones that carry the most weight.
Importance | Example Indicators | Characteristics |
|---|---|---|
High | US Employment Report, FOMC Policy Rate, US CPI | The market tends to move sharply right after release |
Medium | US GDP, ISM Manufacturing Index, Retail Sales | Moderate price moves depending on the content |
Medium to Low | Various countries' business confidence indices, housing-related indicators | Often has limited impact on its own |
US indicators deserve special attention. Since the US dollar is the world's key currency, American figures tend to affect the market as a whole.
Key Economic Indicators You Should Know
US Employment Report
Among all the indicators out there, the US Employment Report is often called the "most closely watched." It's usually published on the first Friday of each month (though it can fall on the second Friday in some months). The figures everyone watches are "Nonfarm Payrolls (NFP)" and the "unemployment rate." The bigger the gap between the market's forecast and the actual number, the more sharply the market reacts.
Nonfarm Payrolls is a figure showing how many jobs were added (or lost) compared to the previous month, excluding the agricultural sector. In Japan Standard Time, it's released around 9:30 PM during US daylight saving time and 10:30 PM during standard time. Dollar-related currency pairs can move sharply during this window, so many traders keep a close eye on this release time.
FOMC (Federal Open Market Committee) and the Policy Rate
The FOMC is the meeting where the Federal Reserve, America's central bank, decides on monetary policy. It's held eight times a year and determines whether the policy rate will be raised, held steady, or cut. Since interest rates directly affect currency values, the market can move sharply based on both the decision itself and the wording of the accompanying statement.
What's more, the FOMC doesn't end with just the announcement. A press conference by the Fed Chair follows immediately, and the market braces itself to gauge whether the tone will be "hawkish" (leaning toward tightening) or "dovish" (leaning toward easing) going forward. Prices can keep drifting throughout the press conference, so this part deserves extra caution.
Consumer Price Index (CPI)
The Consumer Price Index (CPI) shows how much the prices of goods and services have changed — in short, it's an inflation indicator. In the US, it's released monthly by the BLS. It's typically read on a year-over-year and month-over-month basis, and it's worth remembering that "Core CPI," which excludes volatile food and energy prices, is also closely watched. Since central banks tend to raise rates as inflation rises, CPI is heavily scrutinized as a clue to future monetary policy.
With inflation having been a major global concern in recent years, CPI has come to attract almost as much attention as the Employment Report.
Gross Domestic Product (GDP)
Gross Domestic Product (GDP) is the total value added generated within a country over a given period, and it represents the size and growth of that economy. In the US, it's released quarterly by the Bureau of Economic Analysis (BEA), and a distinctive feature is that it's published in stages — advance, second, and final estimates.
GDP is like a thermometer for the overall economy. The market reacts when the figure comes in well above or below expectations. That said, other indicators often give a fairly good sense of what to expect beforehand, so it tends to trigger fewer sudden, dramatic moves than the Employment Report.
ISM Manufacturing Index
The ISM Manufacturing Index is a business sentiment indicator calculated by the Institute for Supply Management (ISM) based on a survey of manufacturing purchasing managers. It's simple to read: 50 is the key threshold, with readings above it signaling economic expansion and readings below it signaling contraction. It's released at the start of each month and is also used as a clue when forecasting the Employment Report.
Bank of Japan Monetary Policy Meeting
This is the meeting where Japan's central bank, the Bank of Japan (BOJ), decides its monetary policy. It's not to be missed if you trade currency pairs involving the Japanese yen. Policy changes or remarks from the Governor can move the yen. Compared to US indicators, things are often fairly calm, but when a shift in monetary policy is anticipated, the yen can move sharply all at once, so don't let your guard down.
How to Keep Track of Economic Indicator Release Times
You can check economic indicators ahead of time using an "economic indicator calendar." Many brokers and financial information sites offer these for free, letting you view the scheduled release date and time, market forecast, previous figure, and importance level all in one list.
Here are a few tips for reading one.
- Releases are based on local time, so convert them to Japan time
- Keep in mind that release times shift by one hour between daylight saving time and standard time
- Look at the "market forecast" and "previous figure" together to gauge how big a surprise might be possible
By the way, in the US, daylight saving time runs from the second Sunday of March to the first Sunday of November. It helps to remember that during this period, major US indicator releases shift one hour earlier in Japan time. People surprisingly often get this wrong and end up thinking, "wait, has it already been released?" so it's a good idea to check this first.
How to Make the Most of Economic Indicators on Bi-Winning
Bi-Winning is a binary options platform with simple, easy-to-use controls. Let's go over some useful mindsets for trading with economic indicators in mind.
- Check the calendar before trading: Just a quick look to see whether an important indicator falls within the time frame you're about to enter can go a long way toward preparing you for unexpected sudden moves.
- Be mindful of your expiry time (time frame): The shorter the time frame, the more it's affected by the choppy price action around an indicator release. Be a little more careful about your choice of time frame right before and after a release.
- Keep the option of not forcing a trade: Right after an indicator release, price action tends to become erratic. If you feel the direction is hard to read, passing on the trade without hesitation is a perfectly valid strategy too.
Economic indicators are like a map that shows you the "reason the market moves." You don't need to master them perfectly from day one. A good place to start is simply learning the release dates of the major indicators and watching how the market actually reacts.
Summary
- Economic indicators are data that express the state of the economy in numbers, and the market tends to move sharply around their release
- The US Employment Report, FOMC, and CPI have the biggest impact — and all three are US indicators
- GDP, the ISM Manufacturing Index, and the BOJ meeting are also worth keeping on your radar
- An economic indicator calendar lets you check the release date and time, market forecast, and importance level in advance
- Watch out for the one-hour shift in release times between daylight saving time and standard time
- If you're trading on Bi-Winning, check the indicator schedule and put it to use within a reasonable, sustainable range
Once you can read economic indicators, you'll gradually start to understand "why the market moved." Understanding the background behind price movements gives you a solid foundation for engaging with binary options in a sustainable way. As a first step, try checking the calendar for the date of the next Employment Report.
Experience the Bi-Winning trading platform risk-free
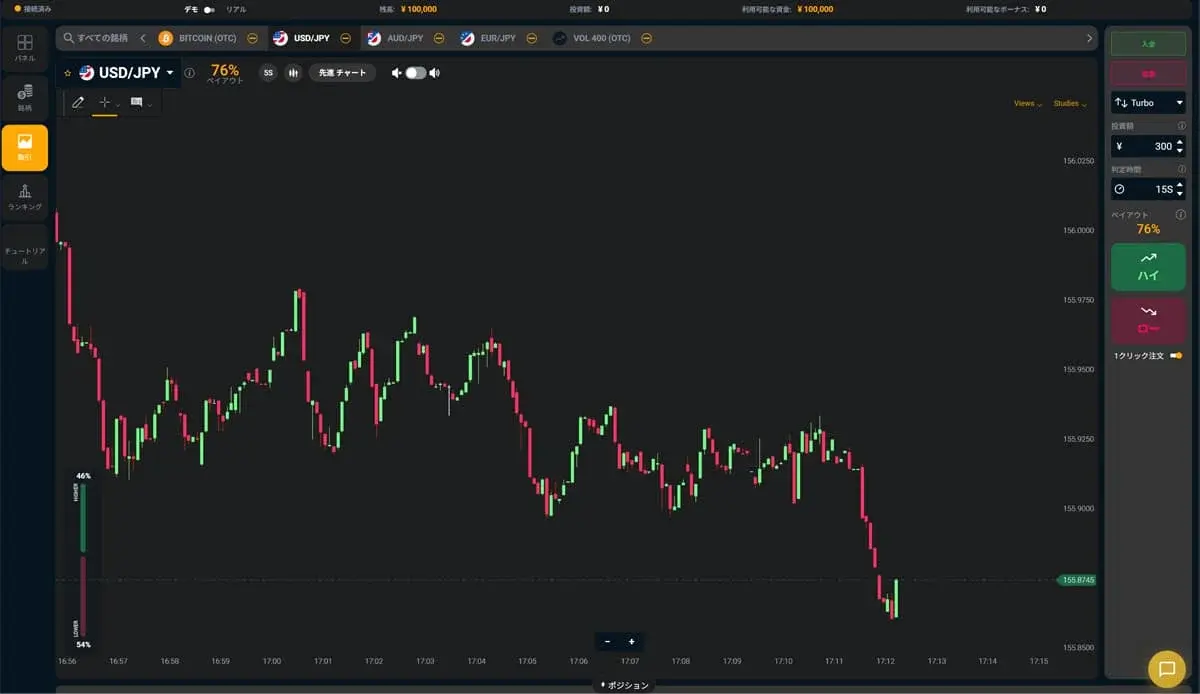
Try the Bi-Winning trading platform for free right now. No registration required to try High/Low trading. Your demo account comes with 100,000 JPY in virtual funds.
Try a free demo now
Experience the real trading environment without using real money
Company Information
Providing a safe, secure, and comfortable trading environment for all investors.
| Company | Alpha Options LLC |
| Location | Euro House, Richmond Hill Road, Kingstown, St. Vincent and the Grenadines |
| Support Hours | 10:00 – 17:00 (JST)Excluding weekends, holidays, and year-end closures |
| Business Succession | Succeeded from BET GLOBAL MARKET INC. on February 7, 2025 |
| Contact | Contact Us |
| Official Twitter | https://x.com/BIWINNING1 |
関連記事

Bi-Winningのサインツール設定方法:MT5への設置手順を画像つきで解説
Bi-Winningのサインツール設定方法を、提携先EdgeGraph FXの口座開設からMT5への設置・表示まで画像つきで解説。IndicatorsフォルダへのファイルのいれかたやM1の設定、表示されないときの対処まで初心者の方向けにまとめました。

How to Deposit via PoiTouch on Bi-Winning: From DEPOT Purchase to Confirmation
We explain how to complete a PoiTouch deposit on Bi-Winning in an easy-to-follow, two-stage process starting with a DEPOT purchase — 11 steps in total. This beginner-friendly guide covers the essentials (a 5,000-yen minimum and instant crediting), things to watch out for when buying multiple DEPOTs or if your deposit isn't reflected, and a comparison with other deposit methods.

What to Watch Out for When Trading During Economic Indicator Releases | Key Precautions for Beginners
When economic indicators are released, the market can swing sharply, bringing risks you don't normally face, such as widening spreads and slippage. This article clearly explains what binary options beginners should watch out for when trading around indicator releases, along with concrete steps to reduce risk.